


Instrumenting the Agent Economy By Creating Early-Warning Signals
Objective: stand up three production measurements within 90 days that tell us where the agent metering war is going before pricing sheets burn us.
0. What we are measuring and why
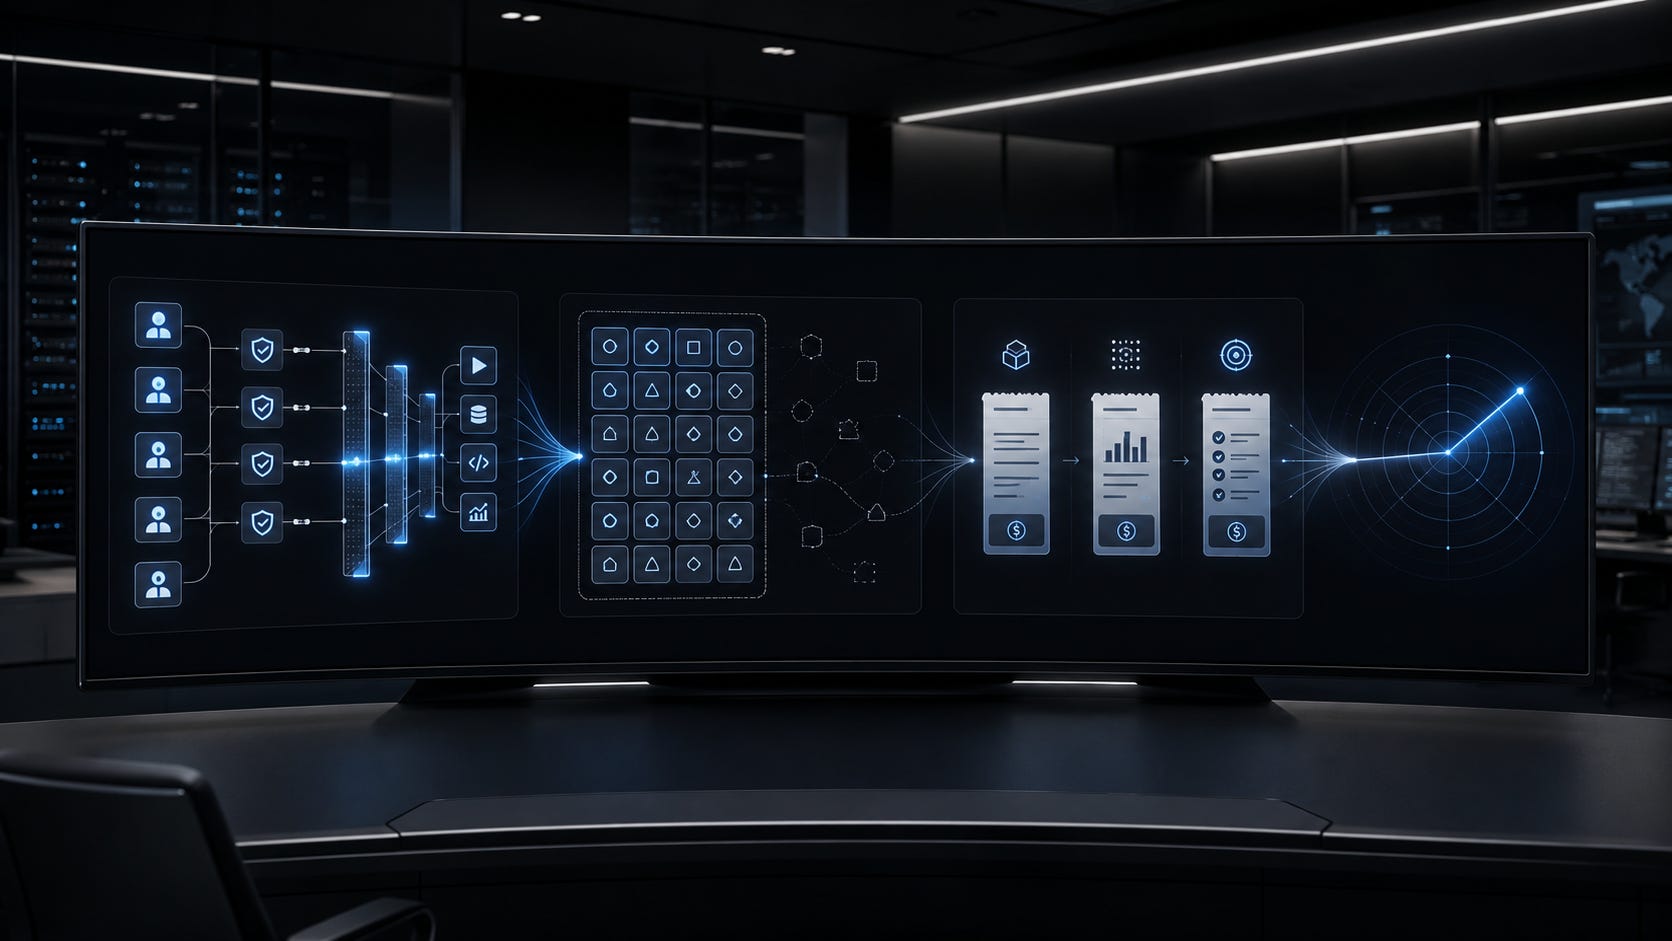
Three signals, each covering a different layer of the same question, at what granularity will agent activity be metered, and is the governance layer real?
Authorization-to-Action Ratio (AAR)
technical squeeze. Is the authorization event scaling with agent activity, or collapsing to session grain?
Registry-Execution Delta (RED)
demand reality. Are agents running that the directory doesn’t know about?
SKU Line-Item Drift (SLID)
commercial resolution. Where are agent charges physically landing on our invoices?
Any one moving hard is signal. All three moving the same direction is the market deciding. Everything below is buildable from systems we already run; no new procurement is required for phase one.
1. Signal 1 — Authorization-to-Action Ratio (AAR)
Definition: per agent identity, per period: AAR = discrete authorization events ÷ discrete consequential actions.
Authorization events: token issuances, token refreshes, policy-decision-point evaluations, delegation/consent grants, step-up verifications.
Consequential actions: tool calls, API writes, file operations, message dispatches, records created/modified/deleted, anything with a side effect. Reads may be excluded in v1; log the exclusion.
1.1 Data sources
Numerator (authZ events): IdP sign-in and token logs (Entra sign-in logs / Okta System Log or equivalent), OAuth authorization-server logs, any PDP or policy-engine decision logs, secrets-manager access events for workload credentials.
Denominator (actions): cloud audit trails (CloudTrail or equivalent), application/tool-call logs from agent platforms, API gateway logs, SaaS audit logs for systems agents touch.
1.2 Build steps
Inventory agent principals. Enumerate every non-human principal that qualifies as an agent: service principals, workload identities, app registrations, API keys, agent-platform identities. Tag them (agent=true, plus owner/sponsor). This tag set is shared infrastructure for Signal 2; build it once.
Land both streams in the SIEM/lake. Both log families almost certainly flow there already; the work is normalization, not collection.
Define the join key. Principal ID (client ID, SPN, key ID) present on both sides. Where actions execute under a delegated human identity, capture the acting-agent claim if the platform emits one; where it doesn’t, log the attribution gap explicitly, that gap is itself a finding.
Compute per-agent AAR daily; report weekly distribution (median, p90, and the tail), not the mean, one chatty agent will destroy an average.
Capture grain metadata alongside: token TTLs, refresh cadence, scope breadth per grant. The ratio tells you what; the grain metadata tells you why it’s moving.
1.3 Thresholds and what they mean
AAR trending toward 1:1 — authorization is scaling with action; fine-grain metering is technically live in our stack; the event-meter thesis is confirmed in our own data.
AAR collapsing toward 1:N (N in the hundreds+), TTLs lengthening, scopes broadening — platforms are coarsening grain; the mid-grain position is being squeezed out in production. This is the kill-switch condition for the metering thesis.
Watch the trend, not the level. The instrument’s product is the quarterly direction of the median and the tail.
1.4 Owner and cadence
Security engineering / IAM team builds; platform engineering supplies action-log coverage. Weekly compute, monthly review, quarterly trend read into strategy.
2. Signal 2 — Registry-Execution Delta (RED)
Definition: RED = agents observably executing − agents registered in the directory, expressed as count and as percentage of registered.
2.1 Data sources
Registry side: directory export of agent identities (Entra agent/app registrations, Okta apps and service accounts, agent-platform registries), plus the CMDB if agent CIs are tracked.
Execution side: endpoint telemetry (EDR process inventory, fleet-management agent-process detection), runtime/workload inventory (container and function inventories), egress logs showing calls to model endpoints and agent frameworks, browser-extension inventories.
2.2 Build steps
Define “observably executing.” V1 heuristic: any process/workload/extension matching a maintained signature list of agent frameworks, model-endpoint calls, or MCP-style tool servers, seen active in the period. Accept imperfection; version the signature list.
Reconcile monthly. Join execution observations to registry entries via principal, host, and owner. Three buckets: matched (registered and running), ghost (registered, never observed running, license/hygiene finding), shadow (running, never registered, the signal).
Attribute shadow items to business unit and owner where possible. The distribution of shadow agents by org unit is the demand map for governance tooling.
Trend the delta. Widening = the ungoverned-agent problem is real and growing. Near-zero across mature environments, the governance layer is a solution ahead of its problem, equally important to know.
2.3 Pitfalls
Egress-based detection will over-count (humans using AI tools ≠ autonomous agents). Separate interactive from headless where the telemetry allows; label the residual uncertainty rather than tuning it away silently.
Don’t let the first shadow-agent report become a compliance witch-hunt, the instrument dies if teams start hiding agents from it. Frame v1 findings as inventory, not violation.
2.4 Owner and cadence
IAM owns the registry side; endpoint/security operations owns the execution side; monthly reconciliation, quarterly trend into strategy.
3. Signal 3 — SKU Line-Item Drift (SLID)
Definition: classification, per vendor per billing cycle, of where agent-related charges physically appear on invoices, tracked over time.
3.1 Data sources
Procurement invoice history, cloud billing exports, license entitlement records, contract amendments and renewal quotes. Twelve months of history minimum for the baseline.
3.2 Build steps
Build the vendor watch-list. Every vendor from which we consume agent capability: identity platforms, cloud providers, SaaS suites shipping embedded agents, agent-platform pure-plays.
Classify each agent-related charge into one of four grains:
G0 — bundled: agent capability inside an existing per-user seat, no separate line.
G1 — per-agent/per-connection: a named identity-count line item (mid-grain).
G2 — consumption: credits, tokens, requests, runtime hours.
G3 — outcome: per-resolution / per-task-completed.
Record grain per vendor per cycle; flag transitions. A vendor moving G0→G1 or G1→G2 is the event. So is a vendor announcing agent pricing and conspicuously staying G0 — absence of the line item after the announcement is itself data.
Capture renewal-quote language, not just invoices, grain shifts appear in quotes two or three quarters before they appear on bills.
Track our own exposure per grain: what percentage of agent-related spend sits at each grain level. That distribution is our negotiating map and our early read on which grain is winning.
3.3 Owner and cadence
Procurement/vendor management owns collection; finance ops classifies; strategy reads quarterly. This is the cheapest of the three instruments, it is a spreadsheet discipline, not an engineering project.
4. Shared infrastructure (build once)
The agent-principal tag set (from 1.2 step 1) is the backbone of Signals 1 and 2, one canonical inventory, one owner, versioned.
A single dashboard, three panels: AAR distribution and trend; RED count, buckets, and trend; SLID grain map by vendor. One page, quarterly narrative attached.
A decision log. Each quarter, record the one-line read per signal and any strategy action taken. The instrument’s value compounds only if direction-over-time is preserved.
5. 30 / 60 / 90
Day 30: agent-principal inventory tagged; SLID baseline classified from trailing 12 months of invoices; AAR data sources confirmed landing in the SIEM.
Day 60: first AAR computation on the top-20 chattiest agents (don’t boil the fleet); execution-side signature list v1; first RED reconciliation on one business unit.
Day 90: full dashboard live; first quarterly read delivered; grain-metadata capture (TTLs, scopes) attached to AAR; decision log opened.
6. Interpretation guardrails
One confounder to pre-register: deliberate batching. Platforms may coarsen authorization grain precisely to avoid creating an expensive event. If AAR collapses while SLID shows vendors holding G0, that is not noise, it is coordinated strategy, and it should be read as the incumbents winning the granularity war, not as the thesis being wrong for lack of a market.
No single-quarter conclusions. Every signal reports as a trend with at least two periods behind it.
The instruments measure our environment, not the market. They generalize only to the extent our vendor mix and agent adoption resemble the median enterprise; state that in every quarterly read.
Status note: signal definitions and thresholds are internal analysis (inference from market structure), not sourced benchmarks; no industry-standard values for AAR or RED exist yet which is precisely why measuring them now is an information advantage.